Problem Statement:
- AtliQ Hardware is a Computer Hardware and Peripheral Manufacturer with regional offices all across the country. The sales recently have been declining and the sales director is having a hard time in tracking the reasons for the decline in sales.
- The sales director needs simple insights presented in the form of an Interactive dashboard from data that are present in multiple files and have more than 150,000 rows.
- SQL - MySql server for EDA
- Tableau - Data modelling, Data Cleaning and visualisation.
Project Overview:
Project files
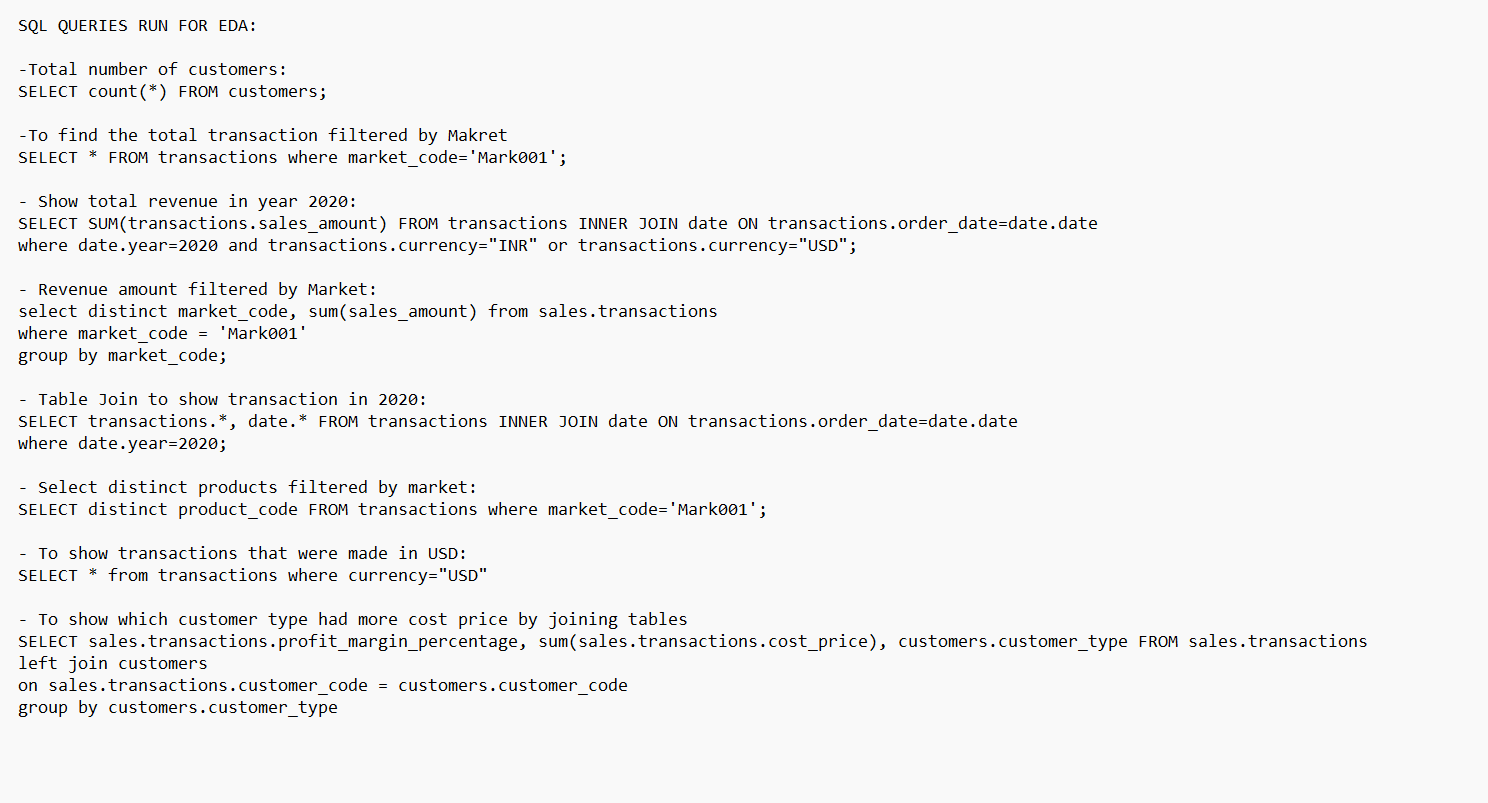
- Used SQL to perform Exploratory Data Analysis and to find trends by joining multiple tables and running queries.
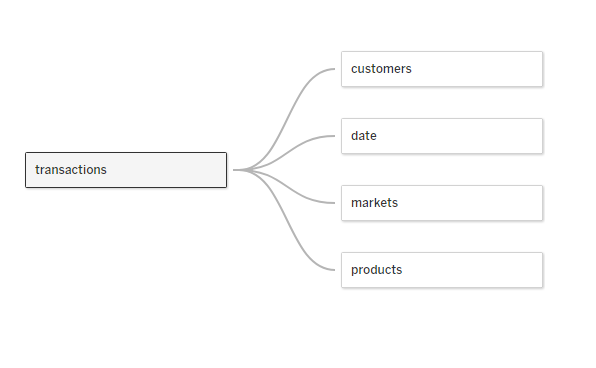
- Connected MySql Database to Tableau and established a data model.
- Cleaned the data in Tableau using inbuilt filter and custom column functions.
- Made an interactive dashboard using Tableau answering all the key questions that would help the sales director in identifying the main reasons for the decline in sales and build effective strategy to boost sales.
Final Dashboard Picture:

SQL Queries Used For EDA:

Data Modelling Using Tableau:

Findings:
- The final dashboard can help the sales director in identifying focus customers and regions with poor performances.
- Marketing strategies of regions with poor results can be compared to strategies of regions with high sales.
- Monthly results can also be comapred in order to find seasonal trends.
- Information of top selling products can be helpful for building better promotional activities.
- Cities that drive in more revenue should be kept in consideration while building marketing strategies.


